Examples of BKPlots
|
|
|
Notes: |
|
|
|
|
|
|
|
Synthetic Data
|
|
|
|
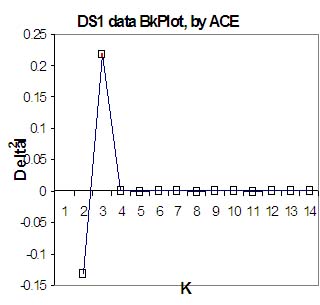
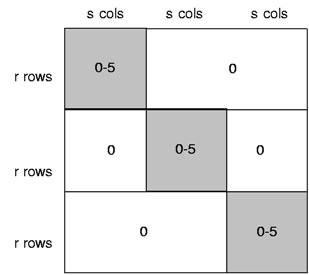
1. Synthetic data DS1 in the following structure
The dark blocks have the randomly generated numbers from 0 to 5. Other areas are filled by 0. This is a clear structure of 3 clusters |
|
|
|
|
|
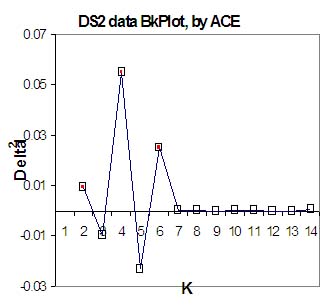
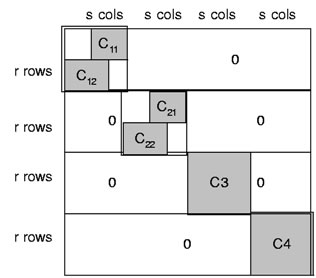
2. synthetic data DS2 in the following structure
Similar to DS1, the dark blocks in DS2 have the randomly generated numbers from 0 to 5. But DS2 has an embeded 2-layer structure. The most significant structure is K=4 (C1*, C2*, C3, C4) and the second significant one is K=6: all of the 6 clusters. K=2 (C1*+C2*, C3 +C4) is less important. |
|
|
|
|
Real Data
|
|
|
|
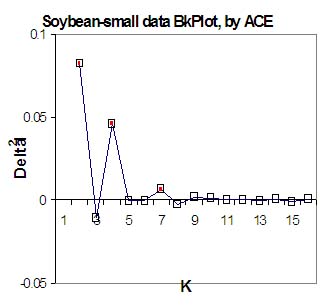
3. Soybean-small data: 35 columns and 47 records. The most significant clustering structures are at K=2 and K=4. A less important one appears at K=7. Most interestingly, ACE clustering at K=4 generates a result 100% consistent with the documented class labels. |
|
|
|
|
|
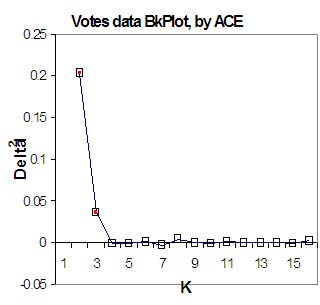
4. Votes data: 16 columns and 435 records. The most significant clustering structures are at K=2 and K=3. ACE clustering at K=2 generates a result 83% consistent with the documented class labels. |
|
|
|
|
|
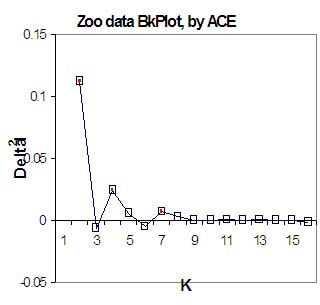
5. Zoo data: 17 columns and 101 records. The most significant clustering structures are at K=2 and K=4. A less important one appears at K=7. ACE clustering at K=7 generates a result 93.1% consistent with the documented class labels. |
|
Real Discretized Numerical Data |
|
|
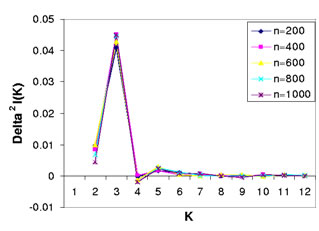
Sample mean BKPlots for census data, with sample size varying from 200 to 1000. For each sample size, the mean of BKPlots of ten sample datasets is calculated. The figure shows that sample mean BKPlots are quite stable, and K=2 and 3 could be the best Ks. |
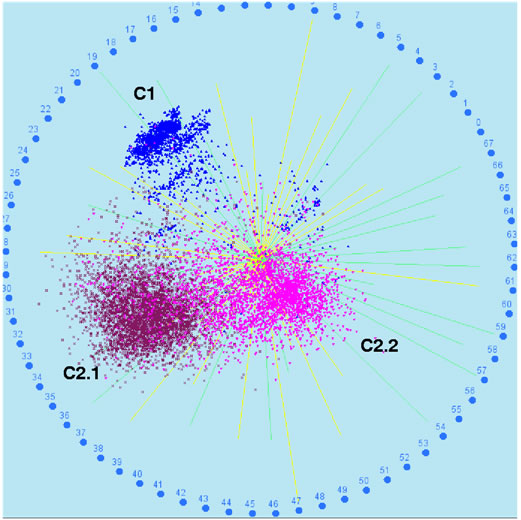
6.Census data: 68 columns and 2,458,284 records Since this is a discretized data, we expect that the numerical distance relationship is partially preserved between the records. Therefore, we can use VISTA visual cluster rendering system to visualize the sample dataset of 10,000 records.
The visualization shows three clusters, two of which (C2.1 and C2.2) are close so we can also group C2.* clusters together. The ACE clustering result of K=3 (visualized with different colors) matches the visual clusters very well. This demonstrates that the two validation methods: VISTA visual rendering and BKPlot method are consistent, although they are based on two sets of entirely different theories. |